
Use case
Inventory and stock reports to PDFwide sheets kept readable
A stock report is the classic too-wide export: SKU, description, bins, counts, valuation. A layout pass slices the columns across pages at readable size instead of crushing them, and flags what clipped.
Free · your file is deleted after converting, never stored · desktop batch needs Excel 2016+ on Windows
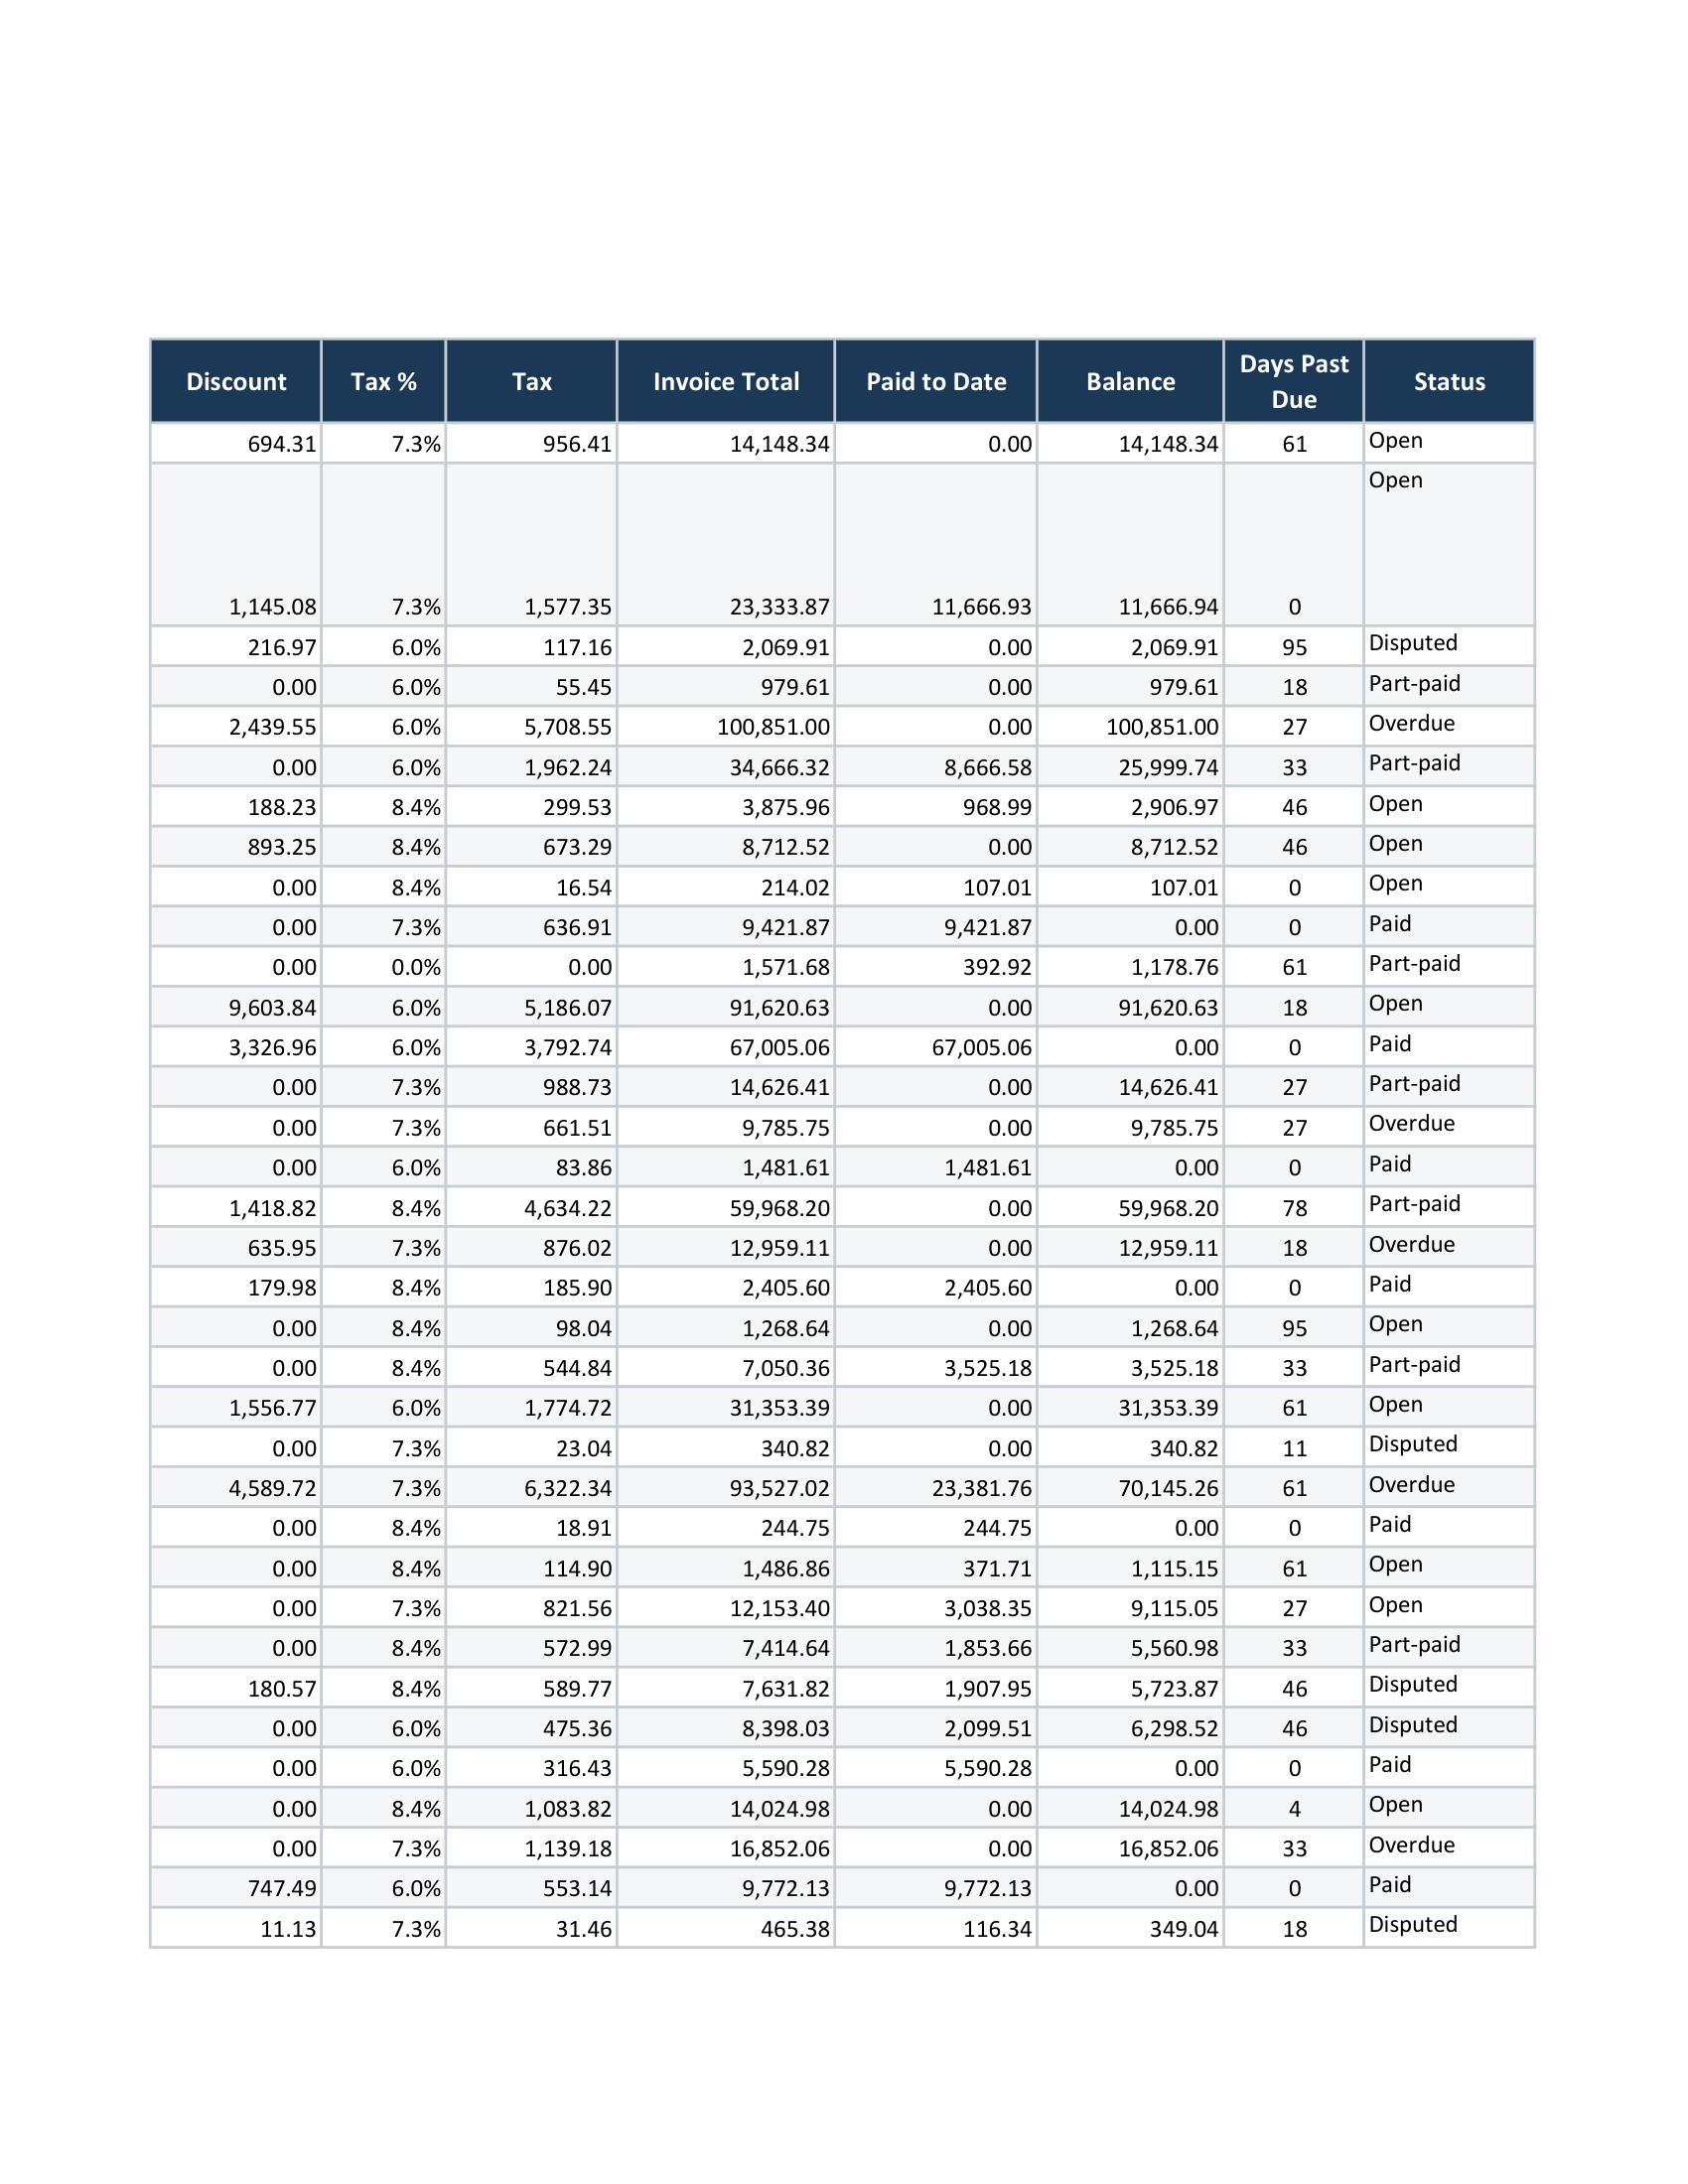
Short answer: A stock report is the widest document most operations teams own — SKU, description, location, bin, on hand, allocated, on order, unit cost, extended value — and it is the export that most reliably comes back unusable. Excel prints it at the width the sheet is set to, so the columns past the paper edge land on their own strip of pages at the back, and the valuation columns end up nowhere near the SKUs they belong to. The fix is a layout pass that measures the real column widths and slices the table across pages at a readable size with the label column repeated, rather than shrinking it until nobody can read it.
Why stock sheets break worse than other reports
Three things compound. The sheet is genuinely wide, often twenty columns or more. The rows are numerous, so the split happens on every page rather than once. And the descriptions wrap, which makes rows tall and unpredictable — a tall row that straddles a page break gets sliced, so a SKU’s description ends on one page and its count begins on the next.
Excel’s own export cannot solve this, because it is not deciding a layout. It is printing the page setup, faithfully, including the parts of the page setup nobody set deliberately.
Excel's export · page 19
Re-laid-out · page 2
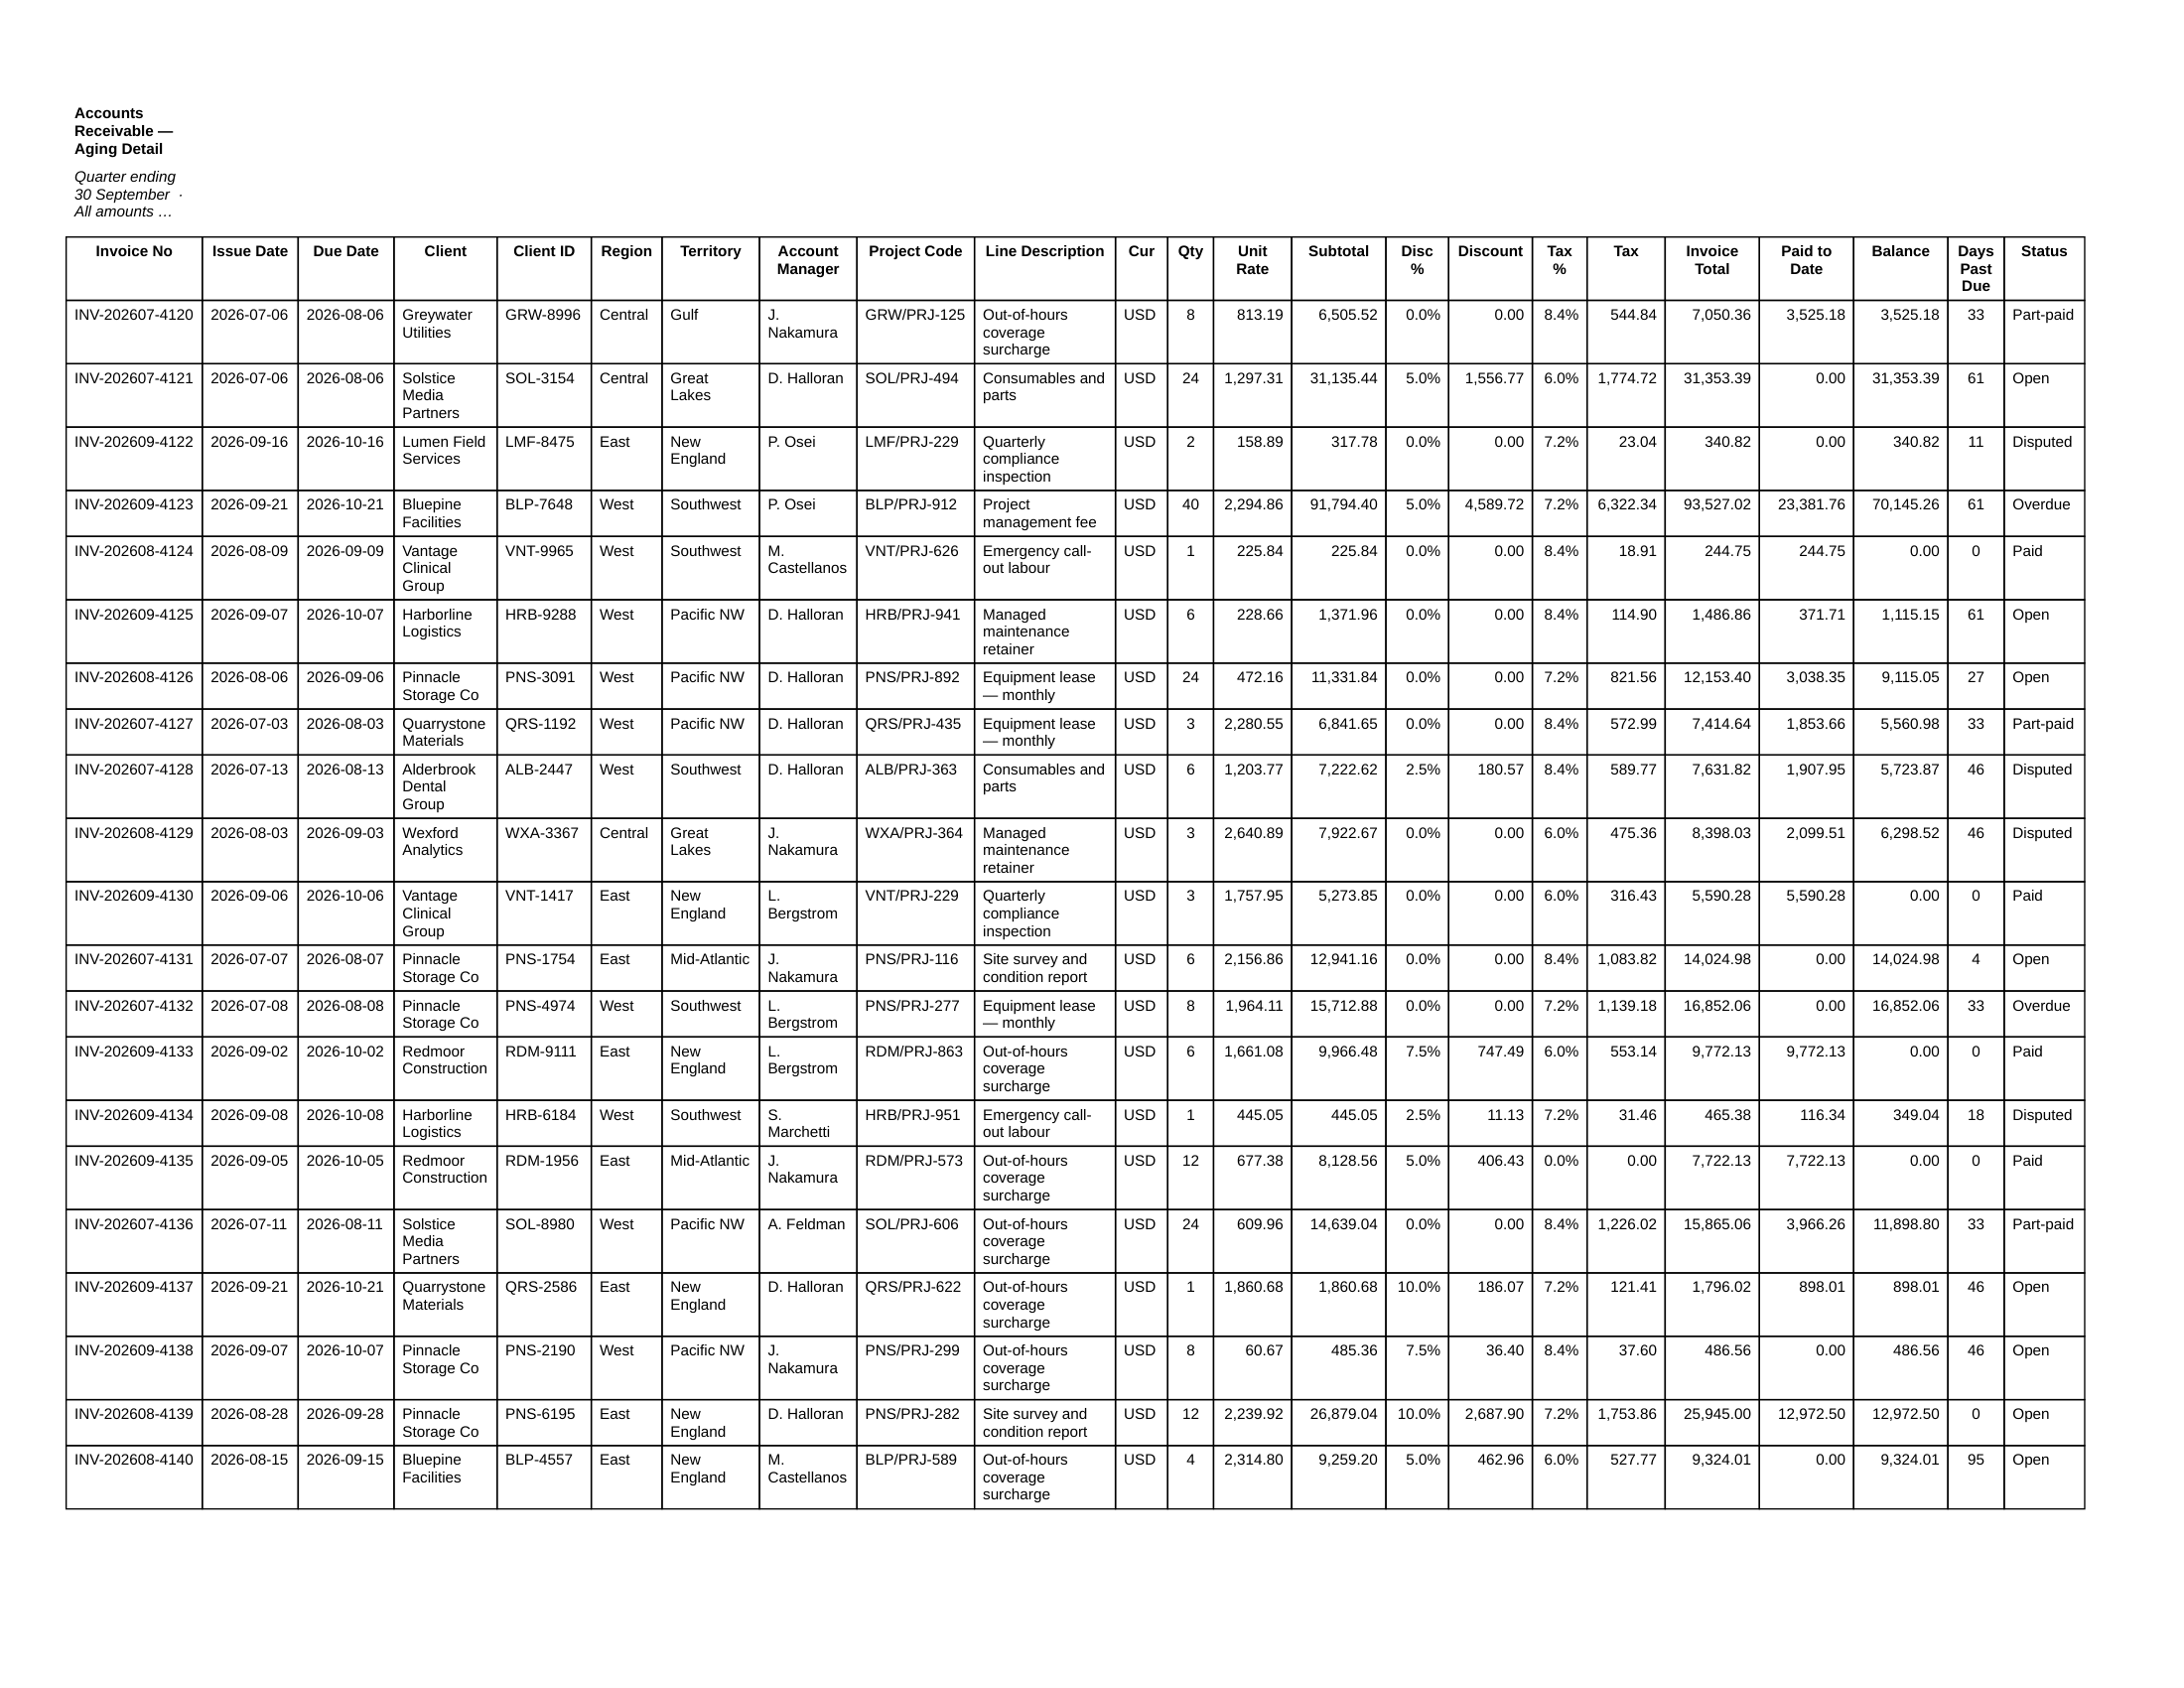
What a layout pass does with a stock sheet
- Measures each column’s real content width and picks portrait or landscape from the shape of the data rather than from the page setup.
- Keeps every row whole. A description that wraps to four lines moves to the next page intact rather than being cut through.
- Slices a too-wide table across pages with the label column repeated on each slice, so the SKU stays beside its numbers instead of eighteen pages away.
- Renders the sheet’s full data range, so a print area set when the report had twelve columns does not decide what a reader sees today. In the desktop and web pre-send review you are told when data from beyond a set print area was included; in batch mode there is no per-file notice yet.
- Flags what still came out wrong. Every rendered file is scanned for blank and clipped pages and the suspects are listed for review. It flags them; it does not edit your workbook.
The recurring run
Stock reports are rarely a single file. A period-end run is a folder: one per warehouse, per location, per client. The Windows desktop app takes the folder in one pass and writes a run log so you can see each file was produced, free for runs of up to five files. It needs Windows with Excel 2016+.
For a single sheet with nothing confidential in it, the free web converter does the same layout work in a browser — it uploads the file, converts it and deletes it afterwards.
Before you send it
Check the last column is present, that no row is cut in half, that the text is readable at paper size, and that nothing that used to be in the report has quietly stopped appearing. The self-check covers the blank and clipped pages; the other two are thirty seconds of your own eyes, and they are the two that get noticed.